ZFS RAIDZ2 - Achieving 157 GB/s
Published on:
Update: See Note 5 below . 157 GB/s is a misleading bandwidth due to the way fio lib handles the --filename option. Actual bandwidth is approximately 22 GB/s, which is still mighty impressive.
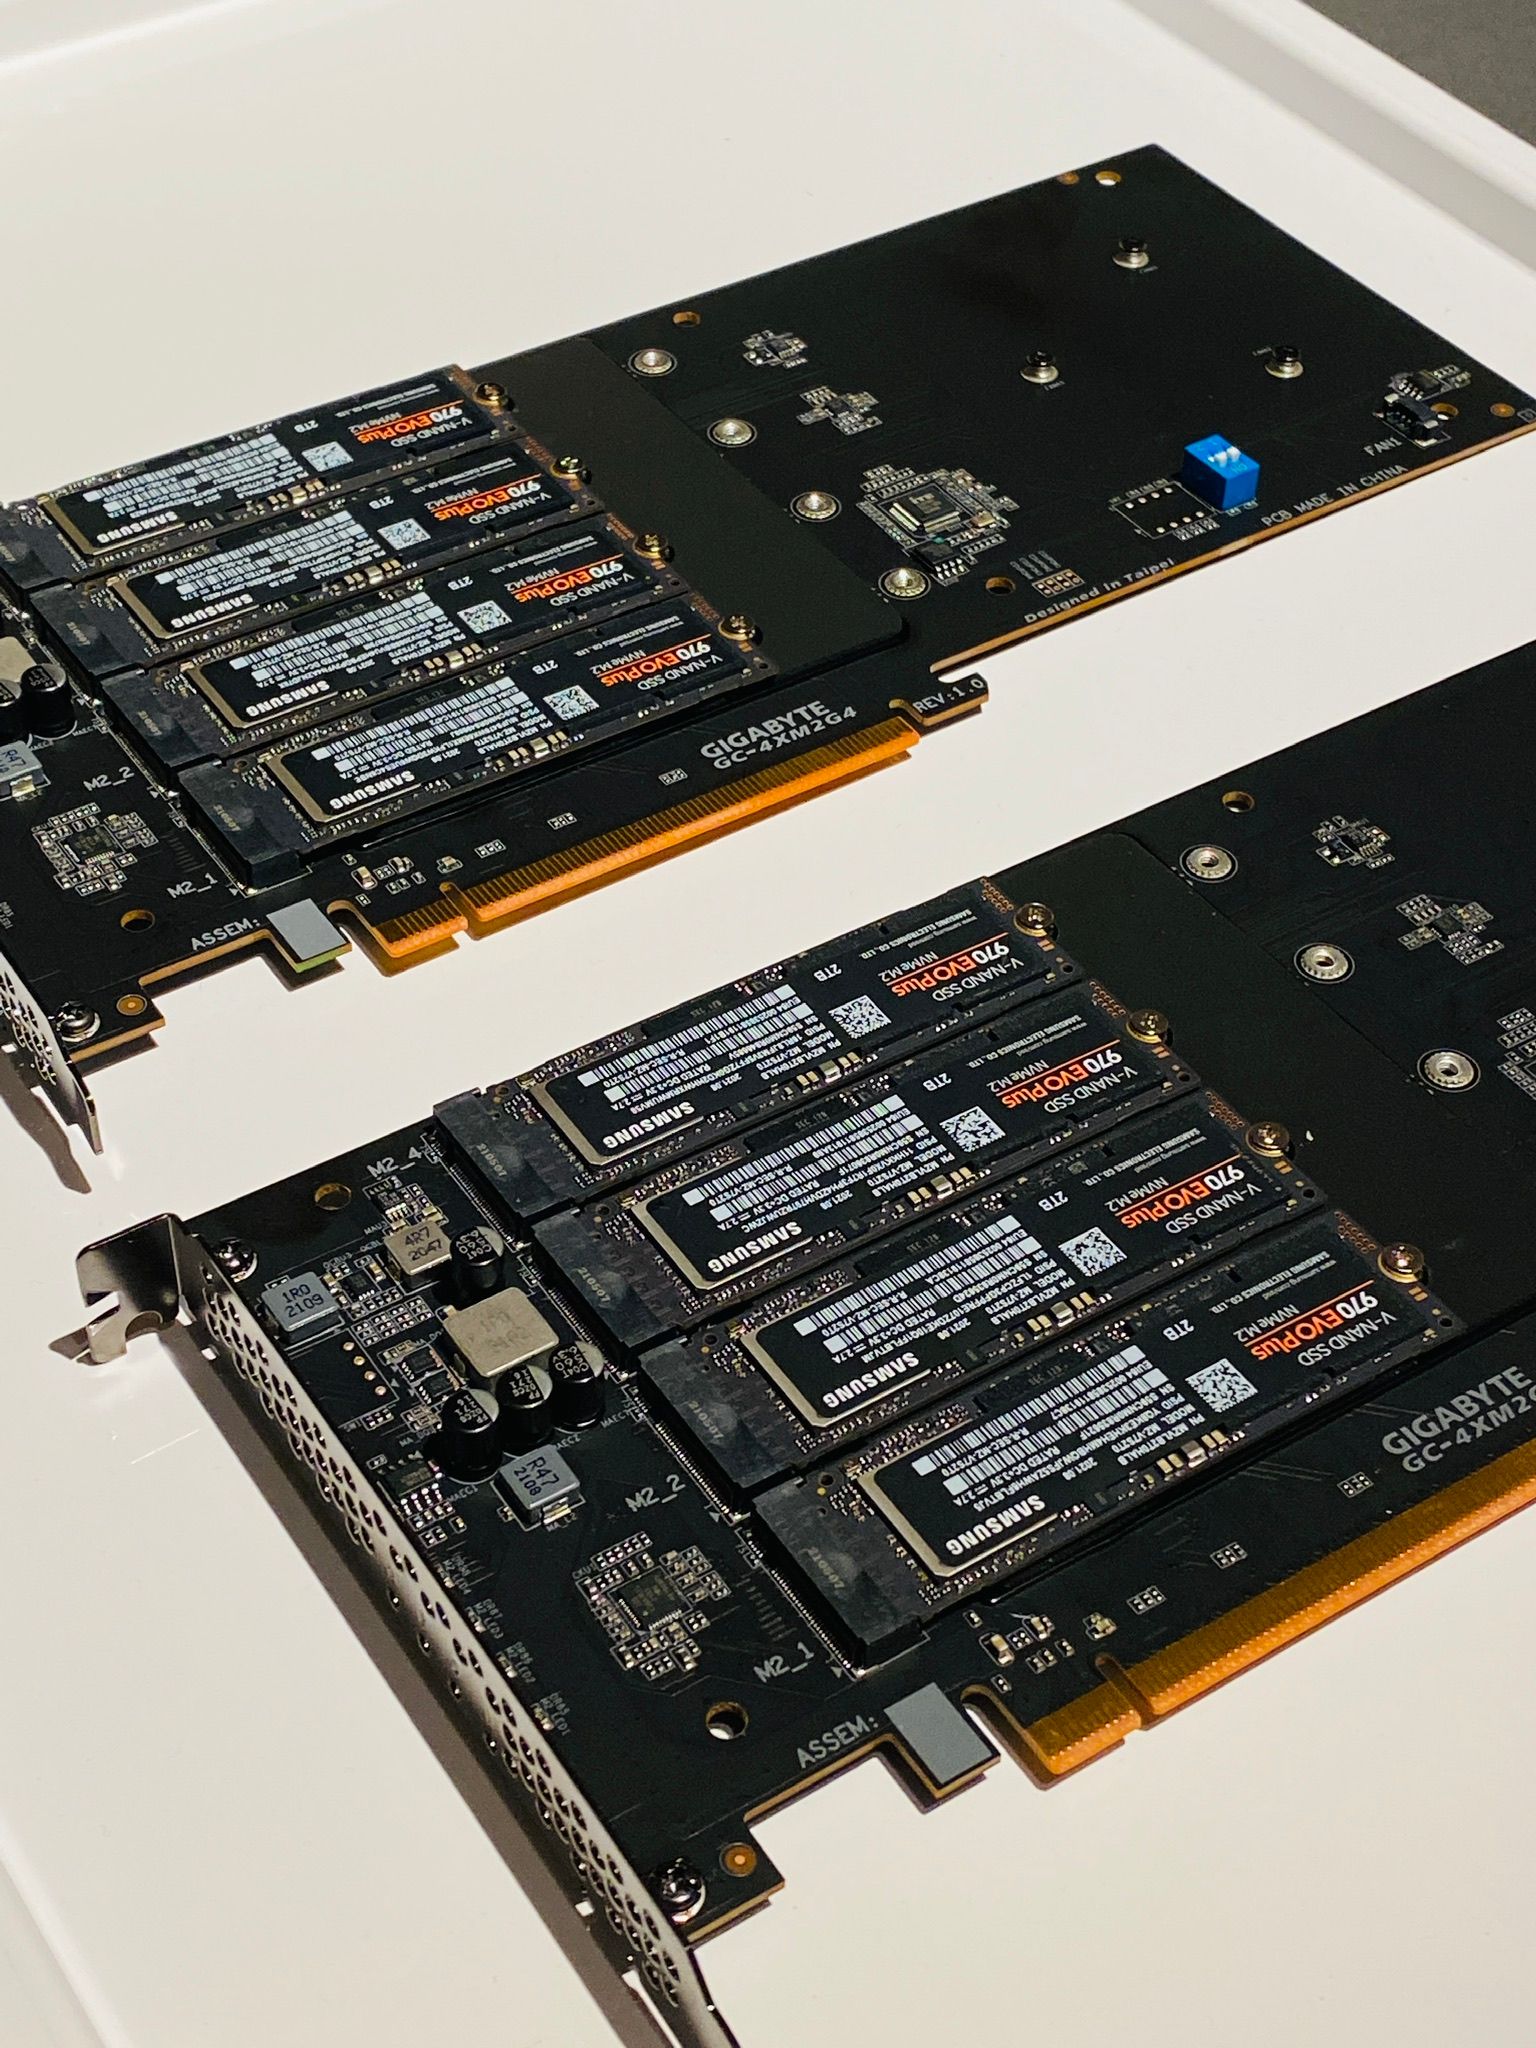
I built a new server that's also going to serve as a NAS. It consists of 8 NVMe drives from Samsung (970 Evo 2TB) with a total capacity of 10.2 TB in RAIDZ2 configuration (2 drive redundancy).
Server specs:
| Neil's Lab Server Specifications | |
|---|---|
| CPU Model | Intel® Xeon® Gold 6326, 16 Cores (32 Threads), 2.90 GHz (Base), 3.50 GHz (Turbo) |
| CPU Cooler | Noctua NH-U12S DX-4189 |
| Motherboard | Supermicro X12SPi |
| RAM | Samsung 6x16GB (96 GB) DDR4-3200 RDIMM ECC PC4-25600R Dual Rank |
| NIC (On board) | Intel X550 2x 10G Base-T |
| NIC (PCIe) | Supermicro AOC-SGP-I4 4x 1GbE |
| OS NVMe | 2x1TB(2TB) Samsung 970 Pro |
| OS NVMe Carrier | Supermicro AOC-SLG3-2M2 PCIe x8 |
| NAS NVMe | 8x2TB(16TB) Samsung 970 Evo |
| NAS NVMe Carrier | 2x Quad Gigabyte GC-4XM2G4 PCIe x16 |
| Power Supply | EVGA 750 Watt 210-GQ-0750-V1 |
| Chassis | NZXT H510i Flow |
PCIe Bifurcation
I am using 2x Gigabyte GC-4XM2G4 PCIe M.2 carrier cards, each can hold upto 4 NVMe drives. These cards have native 4x4x4x4 bifurcation mode in Supermicro BIOS. That means, they're presented to the OS as individual 4 lane PCIe devices, unlike HBA or RAID cards. All 32 PCIe lanes are directly hooked up to the CPU I/O, without having to go through South Bridge chipset.
Build a ZFS raid on Ubuntu 20.04 server:
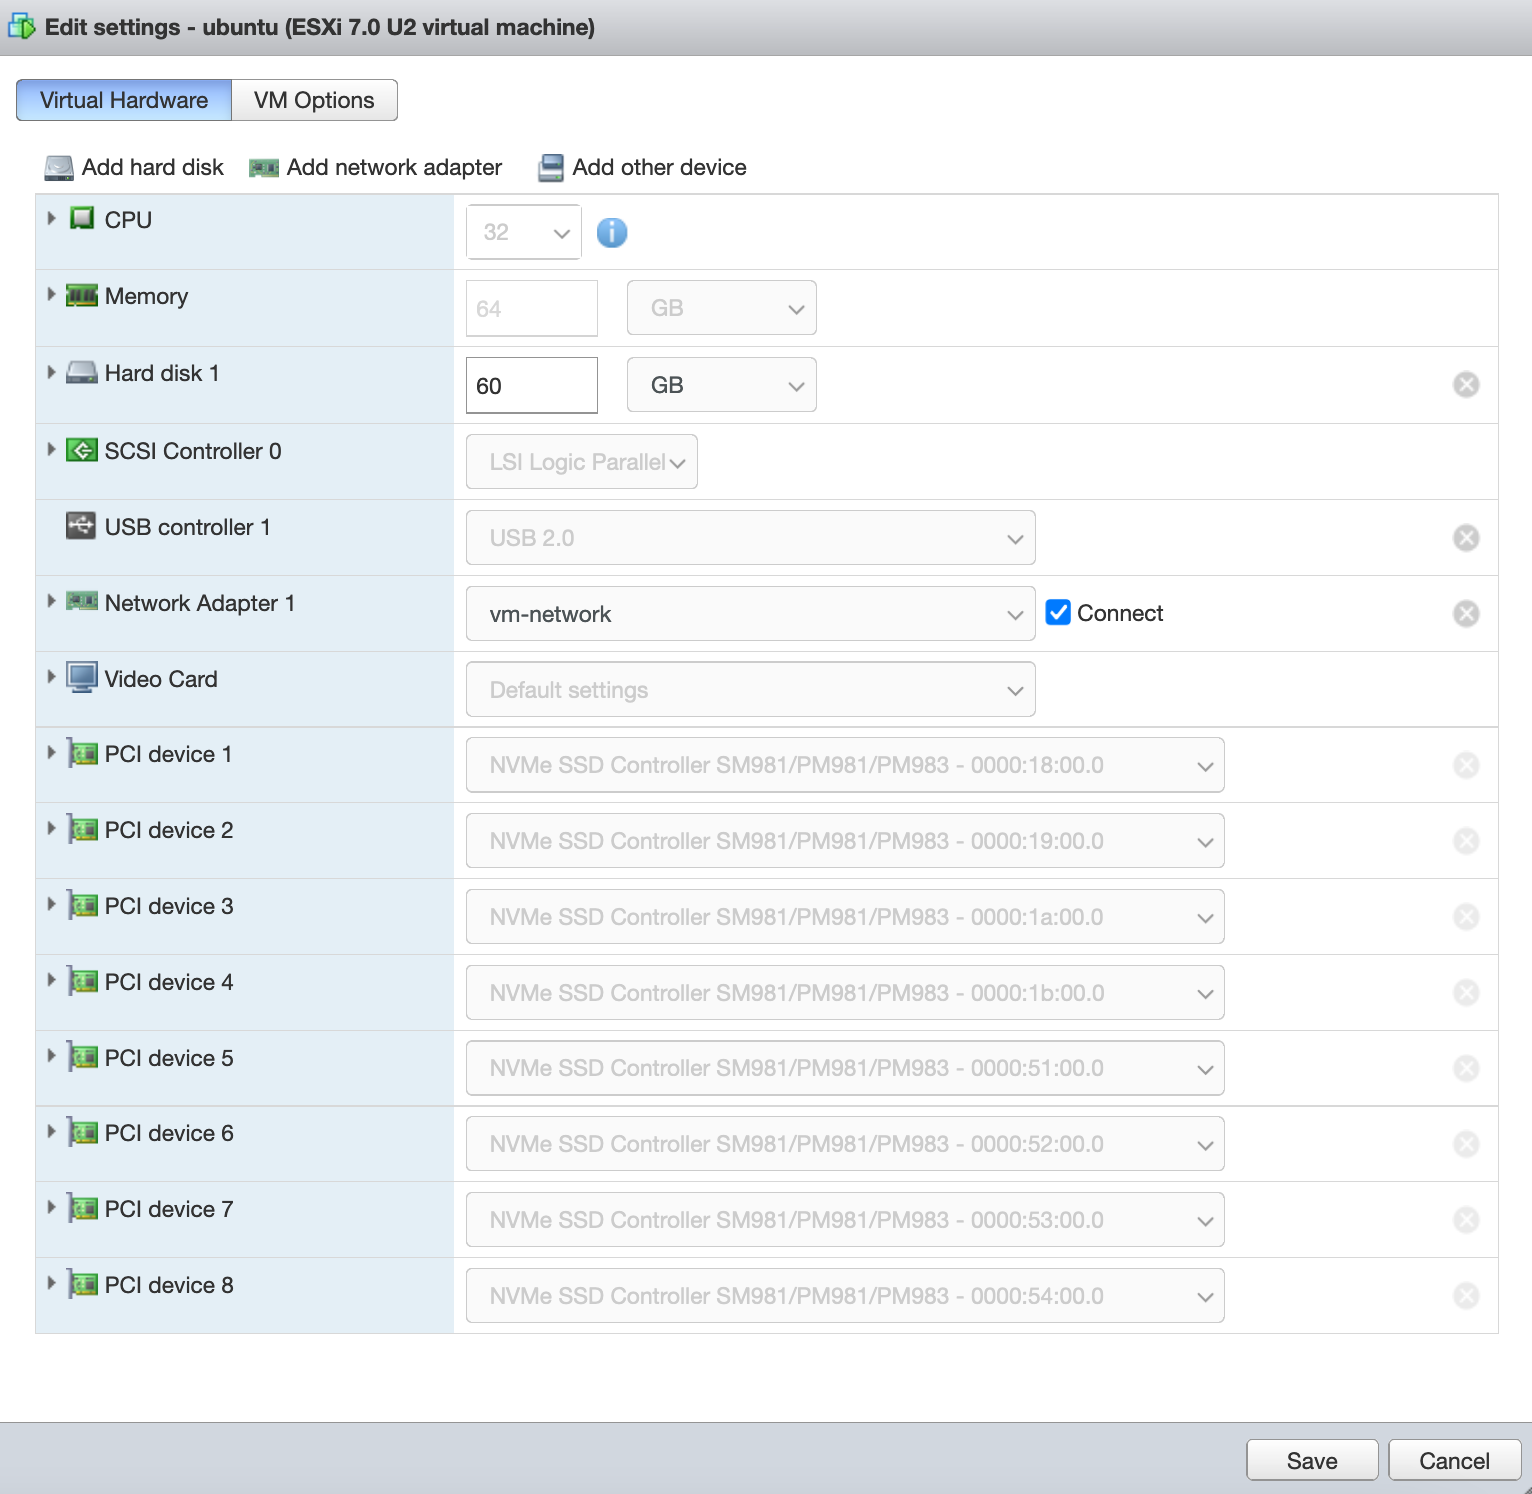
All NVMe drives are in PCIe Passthrough mode on VMWare ESXi:
Install ZFS utils:
sudo apt install zfsutils-linux
Check if it is installed:
neil@ubuntu:~$ lsmod | grep zfs
zfs                  4034560  6
zunicode              331776  1 zfs
zlua                  147456  1 zfs
zavl                   16384  1 zfs
icp                   303104  1 zfs
zcommon                90112  2 zfs,icp
znvpair                81920  2 zfs,zcommon
spl                   126976  5 zfs,icp,znvpair,zcommon,zavl
Check physical disks:
neil@ubuntu:~$ lsblk
NAME                      MAJ:MIN RM  SIZE RO TYPE MOUNTPOINT
loop0                       7:0    0 70.3M  1 loop /snap/lxd/21029
loop1                       7:1    0 55.4M  1 loop /snap/core18/2128
loop2                       7:2    0 32.3M  1 loop /snap/snapd/12704
sda                         8:0    0  100G  0 disk
├─sda1                      8:1    0    1M  0 part
├─sda2                      8:2    0    1G  0 part /boot
└─sda3                      8:3    0   99G  0 part
  └─ubuntu--vg-ubuntu--lv 253:0    0   99G  0 lvm  /
nvme0n1                   259:0    0  1.8T  0 disk
nvme5n1                   259:1    0  1.8T  0 disk
nvme4n1                   259:2    0  1.8T  0 disk
nvme2n1                   259:3    0  1.8T  0 disk
nvme1n1                   259:4    0  1.8T  0 disk
nvme6n1                   259:5    0  1.8T  0 disk
nvme3n1                   259:6    0  1.8T  0 disk
nvme7n1                   259:7    0  1.8T  0 disk
Optionally check for bad block sectors on the disk (I skipped this step since it takes a long time):
sudo badblocks -b 512 -sw /dev/nvme7n1
Testing with pattern 0xaa: 3.68% done, 0:57 elapsed. (0/0/0 errors)
Locate disks by ID:
neil@ubuntu:~$ ls -lh /dev/disk/by-id
lrwxrwxrwx 1 root root 10 Dec  6 04:45 dm-name-ubuntu--vg-ubuntu--lv -> ../../dm-0
lrwxrwxrwx 1 root root 10 Dec  6 04:45 dm-uuid-LVM-Iw3mFxuF9uwlCMJ0yucrWHZwG82z1I6uX0tK6D7CT0Yfb4GXANWiCSjy3E4BoNos -> ../../dm-0
lrwxrwxrwx 1 root root 10 Dec  6 04:45 lvm-pv-uuid-In8DDs-U2jd-TdgQ-BZM3-iACR-HPF3-PT61BX -> ../../sda3
lrwxrwxrwx 1 root root 13 Dec  6 04:45 nvme-eui.00253858119138c7 -> ../../nvme1n1
lrwxrwxrwx 1 root root 13 Dec  6 05:12 nvme-eui.00253858119138ca -> ../../nvme7n1
lrwxrwxrwx 1 root root 13 Dec  6 04:45 nvme-eui.0025385811913a89 -> ../../nvme5n1
lrwxrwxrwx 1 root root 13 Dec  6 04:45 nvme-eui.002538581191b1f1 -> ../../nvme3n1
lrwxrwxrwx 1 root root 13 Dec  6 04:45 nvme-eui.002538581191b32b -> ../../nvme4n1
lrwxrwxrwx 1 root root 13 Dec  6 04:45 nvme-eui.002538581191c362 -> ../../nvme6n1
lrwxrwxrwx 1 root root 13 Dec  6 04:45 nvme-eui.002538581191c369 -> ../../nvme0n1
lrwxrwxrwx 1 root root 13 Dec  6 04:45 nvme-eui.002538581191c472 -> ../../nvme2n1
Create a file /etc/zfs/vdev_id.conf and add the following aliases:
alias nvme0 /dev/disk/by-id/nvme-Samsung_SSD_970_EVO_Plus_2TB_S59CNM0R849603J
alias nvme1 /dev/disk/by-id/nvme-Samsung_SSD_970_EVO_Plus_2TB_S59CNM0R835621F
alias nvme2 /dev/disk/by-id/nvme-Samsung_SSD_970_EVO_Plus_2TB_S59CNM0R849868J
alias nvme3 /dev/disk/by-id/nvme-Samsung_SSD_970_EVO_Plus_2TB_S59CNM0R846665V
alias nvme4 /dev/disk/by-id/nvme-Samsung_SSD_970_EVO_Plus_2TB_S59CNM0R846979M
alias nvme5 /dev/disk/by-id/nvme-Samsung_SSD_970_EVO_Plus_2TB_S59CNM0R836071F
alias nvme6 /dev/disk/by-id/nvme-Samsung_SSD_970_EVO_Plus_2TB_S59CNM0R849596Y
alias nvme7 /dev/disk/by-id/nvme-Samsung_SSD_970_EVO_Plus_2TB_S59CNM0R835624D
Run sudo udevadm trigger or simply reboot the machine. Aliases that we created will now show up under /dev/disk/by-vdev.
neil@ubuntu:~$ ls -lh /dev/disk/by-vdev
lrwxrwxrwx 1 root root 13 Dec  6 05:35 nvme0 -> ../../nvme0n1
lrwxrwxrwx 1 root root 13 Dec  6 05:35 nvme1 -> ../../nvme1n1
lrwxrwxrwx 1 root root 13 Dec  6 05:35 nvme2 -> ../../nvme2n1
lrwxrwxrwx 1 root root 13 Dec  6 05:35 nvme3 -> ../../nvme3n1
lrwxrwxrwx 1 root root 13 Dec  6 05:35 nvme4 -> ../../nvme4n1
lrwxrwxrwx 1 root root 13 Dec  6 05:35 nvme5 -> ../../nvme5n1
lrwxrwxrwx 1 root root 13 Dec  6 05:35 nvme6 -> ../../nvme6n1
lrwxrwxrwx 1 root root 13 Dec  6 05:35 nvme7 -> ../../nvme7n1
Create a zpool.
neil@ubuntu:/dev/disk/by-vdev$ ls
nvme0  nvme1  nvme2  nvme3  nvme4  nvme5  nvme6  nvme7
neil@ubuntu:/dev/disk/by-vdev$ sudo zpool create tank raidz2 nvme0 nvme1 nvme2 nvme3 nvme4 nvme5 nvme6 nvme7
neil@ubuntu:/dev/disk/by-vdev$ zpool status
  pool: tank
 state: ONLINE
  scan: none requested
config:

	NAME        STATE     READ WRITE CKSUM
	tank        ONLINE       0     0     0
	  raidz2-0  ONLINE       0     0     0
	    nvme0   ONLINE       0     0     0
	    nvme1   ONLINE       0     0     0
	    nvme2   ONLINE       0     0     0
	    nvme3   ONLINE       0     0     0
	    nvme4   ONLINE       0     0     0
	    nvme5   ONLINE       0     0     0
	    nvme6   ONLINE       0     0     0
	    nvme7   ONLINE       0     0     0

errors: No known data errors
neil@ubuntu:/dev/disk/by-vdev$
For detailed status, run zpool list -v:
neil@ubuntu:/dev/disk/by-id$ zpool list -v
NAME        SIZE  ALLOC   FREE  CKPOINT  EXPANDSZ   FRAG    CAP  DEDUP    HEALTH  ALTROOT
tank       14.5T   274K  14.5T        -         -     0%     0%  1.00x    ONLINE  -
  raidz2   14.5T   274K  14.5T        -         -     0%  0.00%      -  ONLINE
    nvme0      -      -      -        -         -      -      -      -  ONLINE
    nvme1      -      -      -        -         -      -      -      -  ONLINE
    nvme2      -      -      -        -         -      -      -      -  ONLINE
    nvme3      -      -      -        -         -      -      -      -  ONLINE
    nvme4      -      -      -        -         -      -      -      -  ONLINE
    nvme5      -      -      -        -         -      -      -      -  ONLINE
    nvme6      -      -      -        -         -      -      -      -  ONLINE
    nvme7      -      -      -        -         -      -      -      -  ONLINE
Great. Now we have a zpool.
Create a ZFS filesystem:
Now that we have a zpool named tank, we can create a file system, enable lz4 compression and mount it for performance testing:
neil@ubuntu:/dev/disk/by-vdev$ sudo zfs create tank/fs
neil@ubuntu:/dev/disk/by-vdev$ zfs list
NAME      USED  AVAIL     REFER  MOUNTPOINT
tank      229K  10.5T     47.1K  /tank
tank/fs  47.1K  10.5T     47.1K  /tank/fs
neil@ubuntu:/dev/disk/by-vdev$ sudo zfs set compression=lz4 tank/fs
neil@ubuntu:/dev/disk/by-vdev$ sudo zfs set mountpoint=/home/neil/mnt/disk tank
Excellent. We should have a file system fs located at ~/mnt/disk/fs.
Performance testing using FIO:
FIO testing suite is quite nifty for doing all sorts of I/O testing.
Install FIO tools:
sudo apt install fio
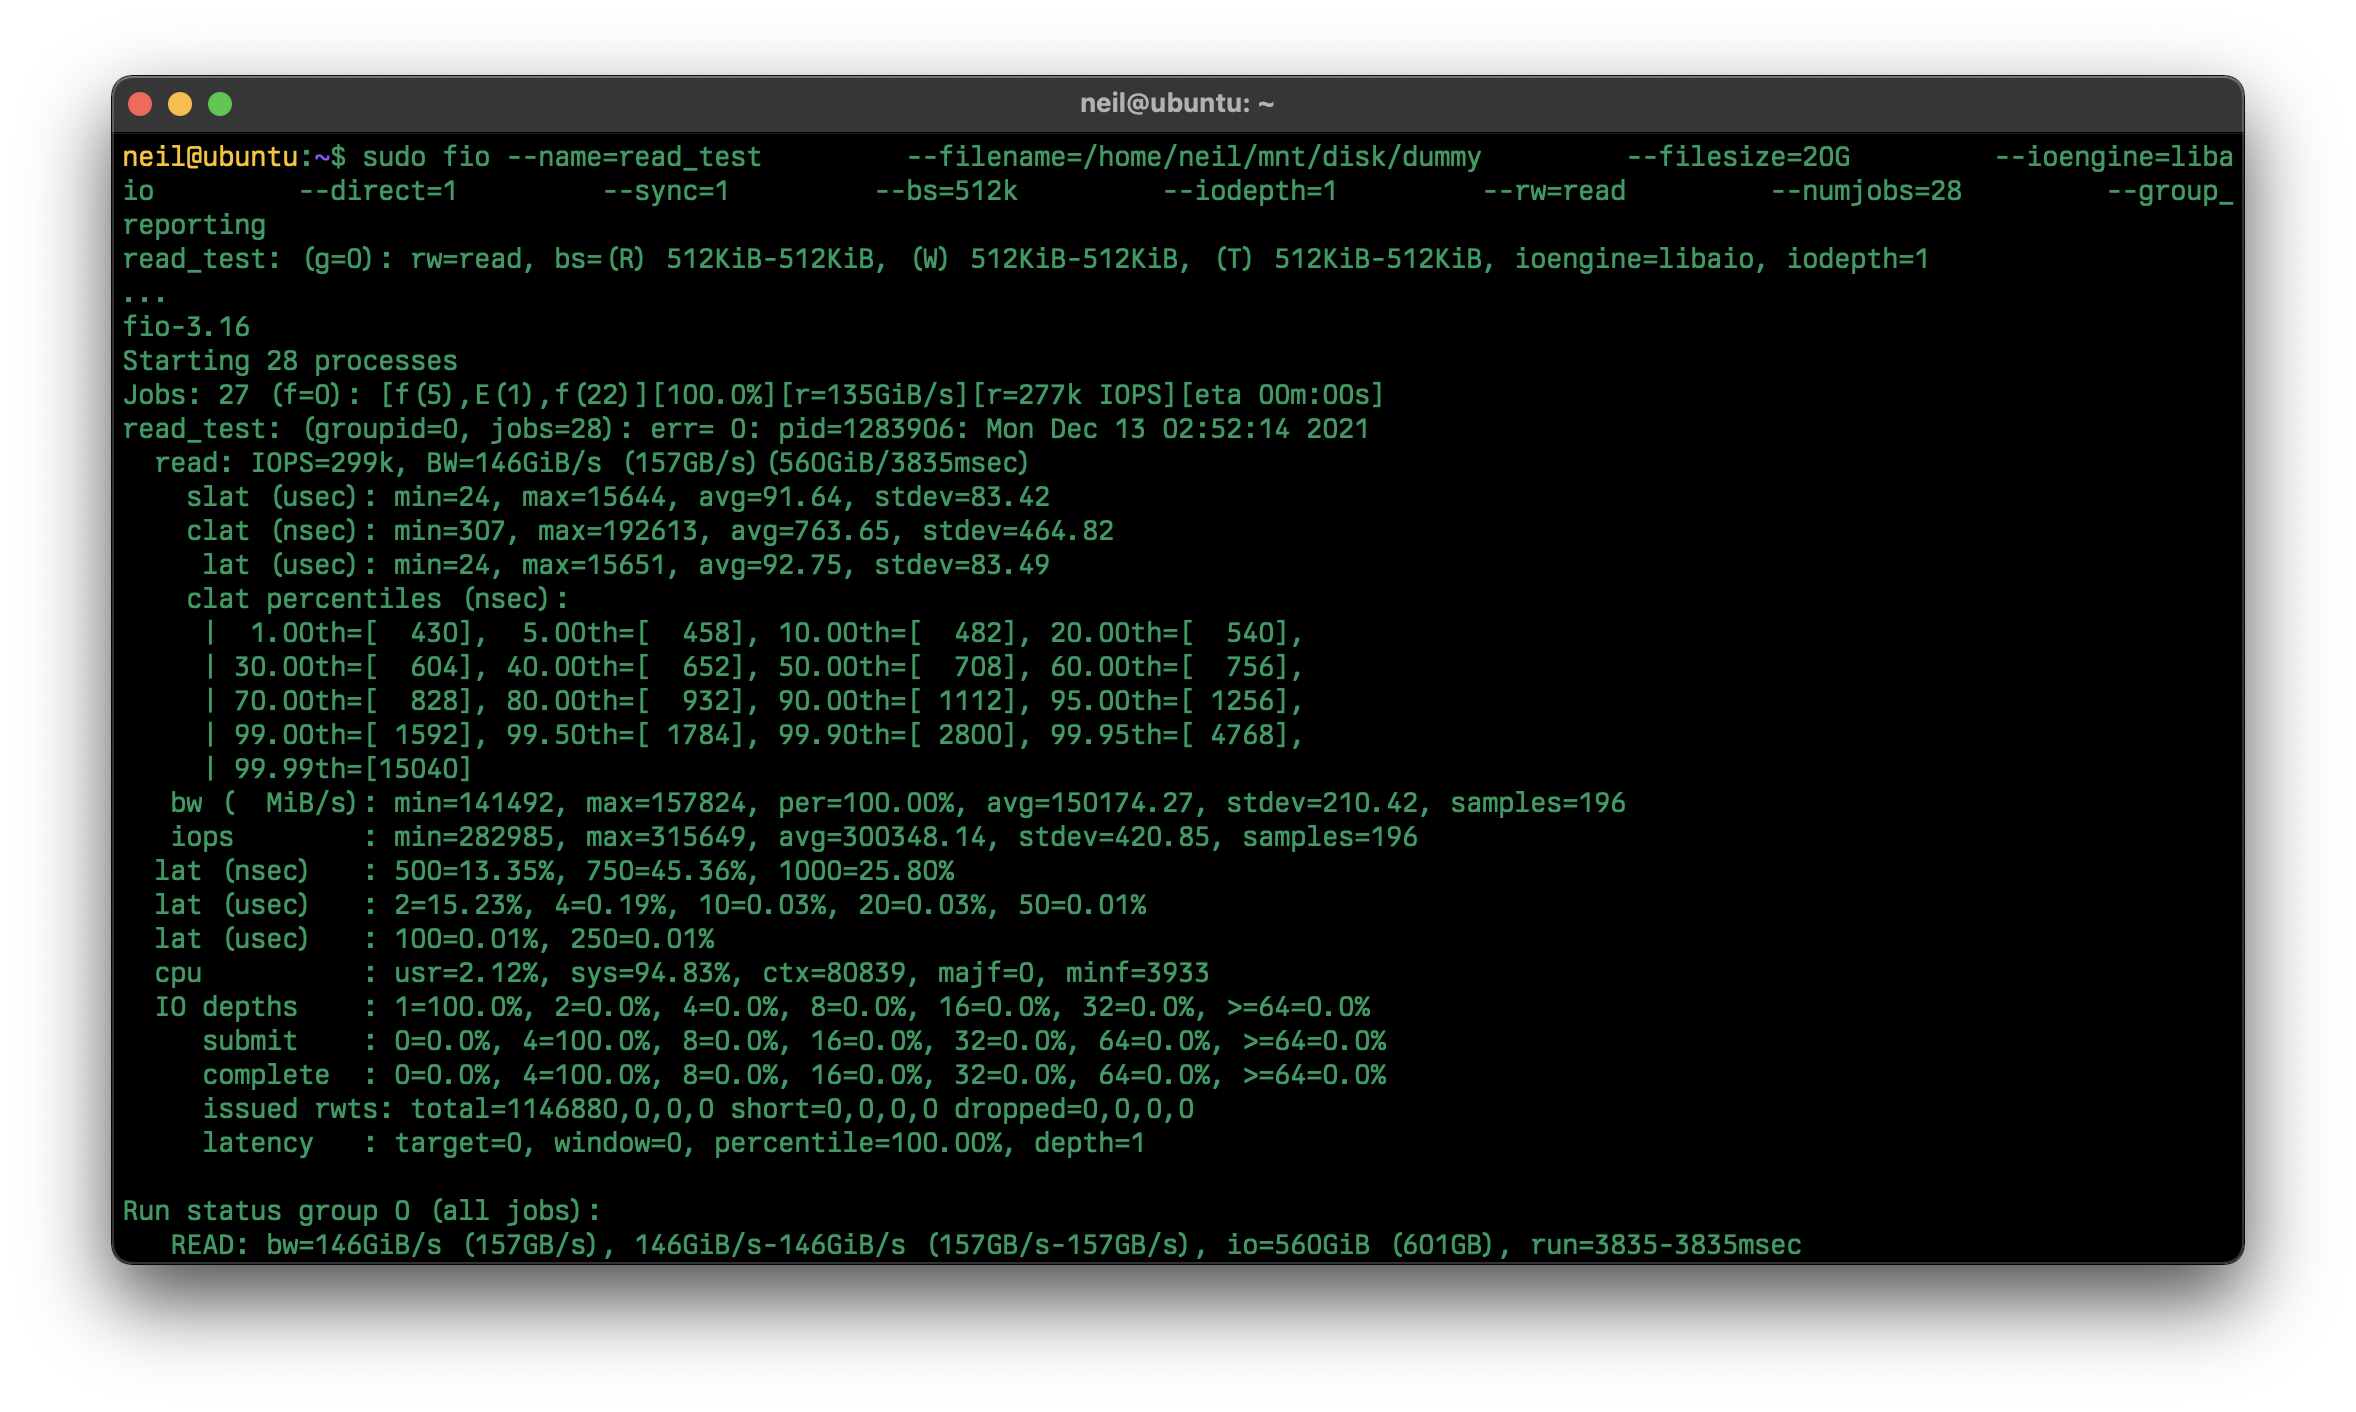
And run the benchmark with block size of 512k and 28 workers:
sudo fio --name=read_test \
        --filename=/home/neil/mnt/disk/dummy \
        --filesize=20G \
        --ioengine=libaio \
        --direct=1 \
        --sync=1 \
        --bs=512k \
        --iodepth=1 \
        --rw=read \
        --numjobs=28 \
        --group_reporting
157 GB/s is insane (sequential reads). That's with lz4 compression and RAIDZ2 configuration! It is trivial to start a sharing service such as nfs , afp or smb in Ubuntu. No need for FreeNAS or TrueNAS.
I don't think we're close to saturating the PCIe bandwidth but using more vCPUs doesn't help with the bandwidth. So, it might be due to the limitations of NVMe controllers.
Hopefully, this is NAS is going to last a decade or so. ZFS is very portable and even if I lose VMWare ESXi image or something goes wrong with the system, I can pullout the PCIe cards housing the NVMe drives, insert them into another system and it will work.
By no means is this a comprehensive disk test. I fiddled around with many different knobs: numjobs, blocksize, direct, sync, etc. Most tests were around 70-100 GB/s sustained sequential reads. I suspect some of the speed is from caching in the RAM, which would explain the absurdity of 157 GB/s. Well, that's even more impressive that ZFS can do that! YMMV.
I'd love to do a more comprehensive test but this thing needs to be permanently mounted and I need to transfer data over from the god-awful[1] QNAP NAS. It is making grumpy SATA noises.
Thanks to Will Yager and Steve Ruff for help during this adventure!
[1] Not because of the performance, but because of how bloated it really is. It literally takes 10 solid minutes to boot. With an attack surface so high (All kinds of apps, docker stuff, plugins, QNAP-cloud thingy, etc), it is completely ridiculous and I can't wait to get rid of it.
Note 1
I am not sure, I think some of it is cached in the RAM. I did a longer sustained test and I am getting about 70 GB/s with a 200GB file - this is definitely larger than 64GB RAM. Is it to do with lz4 compression? Fetching smaller blocks from disk and then decompressing it, thus inflating the bandwidth?
The initial file was created with fio rw=randwrite, so the dummy data is random. I verified with ext4 fs on a single NVMe drive and no matter what knobs I turn, I am getting around around 3.5 GB/s.
Note 2
I just did another 100GB file test with fio, full dump as follows getting about 80 GB/s. This test was run fresh after a system reboot and clearing the drive (no cache). How does this work?:
neil@ubuntu:~/mnt/disk/fs$ sudo fio --name=read_test         --filename=/home/neil/mnt/disk/fs/dummy         --filesize=100G         --ioengine=libaio         --direct=1         --sync=1         --bs=512k         --iodepth=1         --rw=read         --numjobs=28         --group_reporting
read_test: (g=0): rw=read, bs=(R) 512KiB-512KiB, (W) 512KiB-512KiB, (T) 512KiB-512KiB, ioengine=libaio, iodepth=1
...
fio-3.16
Starting 28 processes
read_test: Laying out IO file (1 file / 102400MiB)
Jobs: 28 (f=28): [R(28)][100.0%][r=78.0GiB/s][r=160k IOPS][eta 00m:00s]
read_test: (groupid=0, jobs=28): err= 0: pid=405516: Mon Dec 13 06:00:25 2021
  read: IOPS=152k, BW=74.4GiB/s (79.8GB/s)(2800GiB/37653msec)
    slat (usec): min=20, max=107934, avg=180.88, stdev=1535.31
    clat (nsec): min=248, max=9018.5k, avg=1114.70, stdev=9262.53
     lat (usec): min=20, max=107938, avg=182.57, stdev=1535.47
    clat percentiles (nsec):
     |  1.00th=[   334],  5.00th=[   422], 10.00th=[   494], 20.00th=[   620],
     | 30.00th=[   708], 40.00th=[   796], 50.00th=[   892], 60.00th=[   996],
     | 70.00th=[  1112], 80.00th=[  1272], 90.00th=[  1512], 95.00th=[  1768],
     | 99.00th=[  2800], 99.50th=[  8640], 99.90th=[ 32128], 99.95th=[ 47872],
     | 99.99th=[116224]
   bw (  MiB/s): min=46896, max=93840, per=99.96%, avg=76117.26, stdev=463.15, samples=2100
   iops        : min=93792, max=187680, avg=152233.31, stdev=926.29, samples=2100
  lat (nsec)   : 250=0.01%, 500=10.55%, 750=23.97%, 1000=25.87%
  lat (usec)   : 2=36.82%, 4=2.02%, 10=0.35%, 20=0.24%, 50=0.14%
  lat (usec)   : 100=0.03%, 250=0.01%, 500=0.01%, 750=0.01%, 1000=0.01%
  lat (msec)   : 2=0.01%, 4=0.01%, 10=0.01%
  cpu          : usr=1.59%, sys=54.53%, ctx=3119239, majf=0, minf=3916
  IO depths    : 1=100.0%, 2=0.0%, 4=0.0%, 8=0.0%, 16=0.0%, 32=0.0%, >=64=0.0%
     submit    : 0=0.0%, 4=100.0%, 8=0.0%, 16=0.0%, 32=0.0%, 64=0.0%, >=64=0.0%
     complete  : 0=0.0%, 4=100.0%, 8=0.0%, 16=0.0%, 32=0.0%, 64=0.0%, >=64=0.0%
     issued rwts: total=5734400,0,0,0 short=0,0,0,0 dropped=0,0,0,0
     latency   : target=0, window=0, percentile=100.00%, depth=1

Run status group 0 (all jobs):
   READ: bw=74.4GiB/s (79.8GB/s), 74.4GiB/s-74.4GiB/s (79.8GB/s-79.8GB/s), io=2800GiB (3006GB), run=37653-37653msec
neil@ubuntu:~/mnt/disk/fs$
Note 3
Running the entire VM with 2GB RAM reveals the story. It's due to RAM, but I still don't understand it. With 2GB RAM, we get ~ 20 GB/s which is close to combined bandwidth of all drives (RAIDZ2 would be 6x 3.5GB/s or close to ~20 GB/s). It still doesn't explain how we're able to reach absurd 80 GB/s on a long sustained test.
neil@ubuntu:~/mnt/disk/fs$ sudo fio --name=read_test         --filename=/home/neil/mnt/disk/fs/dummy         --filesize=100G         --ioengine=libaio         --direct=1         --sync=1         --bs=512k         --iodepth=1         --rw=read         --numjobs=28         --group_reporting
[sudo] password for neil:
read_test: (g=0): rw=read, bs=(R) 512KiB-512KiB, (W) 512KiB-512KiB, (T) 512KiB-512KiB, ioengine=libaio, iodepth=1
...
fio-3.16
Starting 28 processes
^Cbs: 28 (f=28): [R(28)][22.6%][r=17.5GiB/s][r=35.9k IOPS][eta 02m:55s]
fio: terminating on signal 2

read_test: (groupid=0, jobs=28): err= 0: pid=4712: Mon Dec 13 06:11:57 2021
  read: IOPS=41.2k, BW=20.1GiB/s (21.6GB/s)(1042GiB/51742msec)
    slat (usec): min=22, max=115406, avg=674.35, stdev=1331.96
    clat (nsec): min=296, max=7427.7k, avg=1850.79, stdev=14919.02
     lat (usec): min=23, max=115409, avg=677.17, stdev=1332.58
    clat percentiles (nsec):
     |  1.00th=[   548],  5.00th=[   676], 10.00th=[   772], 20.00th=[   916],
     | 30.00th=[  1032], 40.00th=[  1176], 50.00th=[  1320], 60.00th=[  1496],
     | 70.00th=[  1688], 80.00th=[  1944], 90.00th=[  2320], 95.00th=[  2672],
     | 99.00th=[  7584], 99.50th=[ 14656], 99.90th=[ 88576], 99.95th=[144384],
     | 99.99th=[301056]
   bw (  MiB/s): min=11908, max=59509, per=100.00%, avg=20627.88, stdev=256.00, samples=2884
   iops        : min=23815, max=119018, avg=41255.16, stdev=512.00, samples=2884
  lat (nsec)   : 500=0.49%, 750=8.39%, 1000=18.05%
  lat (usec)   : 2=55.11%, 4=16.39%, 10=0.82%, 20=0.35%, 50=0.21%
  lat (usec)   : 100=0.10%, 250=0.07%, 500=0.01%, 750=0.01%, 1000=0.01%
  lat (msec)   : 2=0.01%, 4=0.01%, 10=0.01%
  cpu          : usr=0.66%, sys=25.64%, ctx=4108148, majf=0, minf=3923
  IO depths    : 1=100.0%, 2=0.0%, 4=0.0%, 8=0.0%, 16=0.0%, 32=0.0%, >=64=0.0%
     submit    : 0=0.0%, 4=100.0%, 8=0.0%, 16=0.0%, 32=0.0%, 64=0.0%, >=64=0.0%
     complete  : 0=0.0%, 4=100.0%, 8=0.0%, 16=0.0%, 32=0.0%, 64=0.0%, >=64=0.0%
     issued rwts: total=2133831,0,0,0 short=0,0,0,0 dropped=0,0,0,0
     latency   : target=0, window=0, percentile=100.00%, depth=1

Run status group 0 (all jobs):
   READ: bw=20.1GiB/s (21.6GB/s), 20.1GiB/s-20.1GiB/s (21.6GB/s-21.6GB/s), io=1042GiB (1119GB), run=51742-51742msec
neil@ubuntu:~/mnt/disk/fs$
Note 4
Turning lz4 compression didn't make much difference.
Last login: Mon Dec 13 06:09:18 2021 from 10.0.0.42
neil@ubuntu:~$ sudo zfs set compression=off tank/fs
[sudo] password for neil:
neil@ubuntu:~$ sudo fio --name=read_test         --filename=/home/neil/mnt/disk/fs/dummy         --filesize=100G         --ioengine=libaio         --direct=1         --sync=1         --bs=512k         --iodepth=1         --rw=read         --numjobs=28         --group_reporting
read_test: (g=0): rw=read, bs=(R) 512KiB-512KiB, (W) 512KiB-512KiB, (T) 512KiB-512KiB, ioengine=libaio, iodepth=1
...
fio-3.16
Starting 28 processes
Jobs: 28 (f=28): [R(28)][100.0%][r=78.4GiB/s][r=161k IOPS][eta 00m:00s]
read_test: (groupid=0, jobs=28): err= 0: pid=4520: Mon Dec 13 06:29:25 2021
  read: IOPS=156k, BW=76.2GiB/s (81.8GB/s)(2800GiB/36751msec)
    slat (usec): min=19, max=105788, avg=176.71, stdev=1535.16
    clat (nsec): min=247, max=16074k, avg=993.84, stdev=11978.23
     lat (usec): min=20, max=105793, avg=178.24, stdev=1535.33
    clat percentiles (nsec):
     |  1.00th=[   330],  5.00th=[   398], 10.00th=[   462], 20.00th=[   564],
     | 30.00th=[   644], 40.00th=[   716], 50.00th=[   788], 60.00th=[   884],
     | 70.00th=[   988], 80.00th=[  1128], 90.00th=[  1352], 95.00th=[  1576],
     | 99.00th=[  2256], 99.50th=[  4448], 99.90th=[ 27776], 99.95th=[ 47872],
     | 99.99th=[128512]
   bw (  MiB/s): min=20186, max=96350, per=100.00%, avg=78083.60, stdev=532.92, samples=2044
   iops        : min=40373, max=192700, avg=156166.03, stdev=1065.84, samples=2044
  lat (nsec)   : 250=0.01%, 500=13.73%, 750=31.22%, 1000=25.80%
  lat (usec)   : 2=27.66%, 4=1.06%, 10=0.22%, 20=0.16%, 50=0.09%
  lat (usec)   : 100=0.03%, 250=0.01%, 500=0.01%, 750=0.01%, 1000=0.01%
  lat (msec)   : 2=0.01%, 4=0.01%, 10=0.01%, 20=0.01%
  cpu          : usr=1.54%, sys=54.57%, ctx=2605775, majf=0, minf=3927
  IO depths    : 1=100.0%, 2=0.0%, 4=0.0%, 8=0.0%, 16=0.0%, 32=0.0%, >=64=0.0%
     submit    : 0=0.0%, 4=100.0%, 8=0.0%, 16=0.0%, 32=0.0%, 64=0.0%, >=64=0.0%
     complete  : 0=0.0%, 4=100.0%, 8=0.0%, 16=0.0%, 32=0.0%, 64=0.0%, >=64=0.0%
     issued rwts: total=5734400,0,0,0 short=0,0,0,0 dropped=0,0,0,0
     latency   : target=0, window=0, percentile=100.00%, depth=1

Run status group 0 (all jobs):
   READ: bw=76.2GiB/s (81.8GB/s), 76.2GiB/s-76.2GiB/s (81.8GB/s-81.8GB/s), io=2800GiB (3006GB), run=36751-36751msec
neil@ubuntu:~$
Note 5
I was able to get to the bottom of this madness. 157 GB/s (or even 70 GB/s) is a misleading number. Essentially, fio requires a separate file for each thread using the : symbol in the --filename argument.
I create separate files for each thread. Ran the test with 4, 8, and 16 jobs. Looks like it gets worse after 8 threads.
neil@ubuntu:~/mnt/disk$ ls
  dummy0  dummy10  dummy12  dummy14  dummy2  dummy4  dummy6  dummy8
  dummy1  dummy11  dummy13  dummy15  dummy3  dummy5  dummy7  dummy9
  neil@ubuntu:~/mnt/disk$ sudo fio --name=read_test \
  >         --filename=/home/neil/mnt/disk/dummy0:/home/neil/mnt/disk/dummy1:/home/neil/mnt/disk/dummy2:/home/neil/mnt/disk/dummy3:/home/neil/mnt/disk/dummy4:/home/neil/mnt/disk/dummy5:/home/neil/mnt/disk/dummy6:/home/neil/mnt/disk/dummy7:/home/neil/mnt/disk/dummy8:/home/neil/mnt/disk/dummy9:/home/neil/mnt/disk/dummy10:/home/neil/mnt/disk/dummy11:/home/neil/mnt/disk/dummy12:/home/neil/mnt/disk/dummy13:/home/neil/mnt/disk/dummy14:/home/neil/mnt/disk/dummy15 \
  >         --filesize=20G \
  >         --ioengine=libaio \
  >         --direct=1 \
  >         --sync=1 \
  >         --bs=512k \
  >         --iodepth=1 \
  >         --rw=read \
  >         --numjobs=16 \
  >         --group_reporting
This results in a modest ~ 15 GB/s sequential read speed. If I use --numjobs=8, I get around ~22 GB/s which is quite believable. Modest, but still mighty impressive! Thanks to folks on HN and Lobste.rs for chiming in.
Discuss on HN → Discuss on Lobste.rs →